Young children are natural data collectors. They eagerly count, sort, and compare everything from toys to snacks. The Year 1 curriculum at Matholia.com harnesses this innate curiosity by introducing formal data representation through tally charts and picture graphs – the building blocks of mathematical literacy.
The Journey Begins with Tally Charts
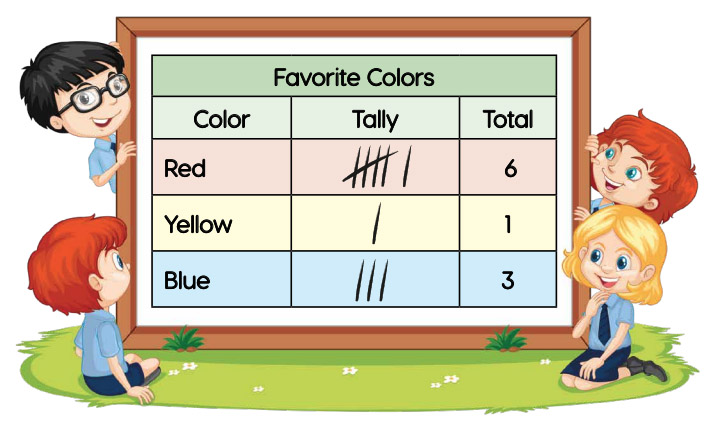
In the Learn section, we meet Dominic, who asks his friends about their favorite colors. This simple scenario demonstrates how tally charts connect to children’s everyday experiences. Students discover that each tally mark represents one response, and they learn to bundle these marks in groups of five for easier counting.
The Making Tally Charts video reinforces this concept beautifully with a garden setting. As Blake counts the different colored flowers, students observe how each flower earns one tally mark, creating a visual relationship between the concrete objects and their abstract representation.
Picture Graphs: Bringing Data to Life
The curriculum then progresses naturally to picture graphs, where students work with Vivian to sort and count marbles by color. These activities teach students to:
- Group items by attributes (color, shape, size)
- Count items in each group
- Represent quantities using pictures or symbols
- Compare groups using mathematical language (more, fewer, same)
The Making Picture Graphs video expands on these skills using farm animals and pond creatures, showing students how to organize information in a structured format that makes visual comparison intuitive.
Why This Matters
When Year 1 students learn to create and interpret tally charts and picture graphs, they’re developing far more than math skills. They’re acquiring:
- Organizational thinking: Learning to sort and categorize information
- Visual literacy: Understanding that symbols can represent quantities
- Mathematical communication: Using data to answer questions and make comparisons
- Analytical foundations: Recognizing patterns and relationships in information
Assessment That Builds Confidence
Matholia’s assessment materials show thoughtful progression through data concepts. Students begin with tally charts, counting kitchen utensils and surveying favorite fruits while learning to organize information and mark tallies in groups of five.
The picture graph worksheets build on this foundation, using engaging contexts like Michelle’s toy collection and Halie’s fast food survey to teach one-to-one correspondence. Students not only interpret existing graphs but create their own, transitioning from counting shapes to representing car colors with symbols.
The ‘At Home’ worksheets connect data collection to children’s environments, encouraging them to count animals at a pond and cars on a road while developing comparison vocabulary like “more than” and “fewer than.”
These carefully sequenced activities gradually build students’ confidence as they master increasingly complex data representations, preparing them to understand how the same information can be displayed in multiple formats—an essential foundation for future mathematical learning.


Classroom Applications
Teachers and parents can extend these concepts beyond the Matholia resources by:
- Conducting classroom surveys about favorites (colors, pets, fruits)
- Creating a weather graph to track daily conditions
- Sorting classroom objects and representing the count with tally marks
- Using picture graphs to track classroom activities or achievements
By introducing data representation in contexts that matter to young learners, Year 1 students begin to see themselves as capable mathematicians who can collect, organize, and make sense of information in their world. These early experiences with tally charts and picture graphs provide the essential foundation for the more complex data analysis skills they’ll develop throughout their mathematical journey.
Students begin their data journey with tally charts, bundling marks in groups of five to count collections like Blake’s garden flowers. These concrete representations pave the way for picture graphs, building early visual literacy skills that extend beyond mathematics into everyday decision-making.